In the world of network security and management, FortiGate stands out as a robust solution offering a myriad of features to ensure optimal performance and security. One of the key components in maintaining a healthy network infrastructure is effective monitoring, and FortiGate provides powerful tools to achieve this goal. In this blog post, we will delve into the setup and configuration of the Health Link Monitor in FortiGate, both through the graphical user interface (GUI) and the command-line interface (CLI), empowering you with the knowledge to optimize your network’s health.
Understanding Health Link Monitor
Before diving into the configuration, let’s understand what the Health Link Monitor (HLM) does. HLM is a feature in FortiGate that monitors the health of links between devices or networks. It continuously checks the status of these links and takes predefined actions based on the results. This proactive monitoring helps in maintaining network uptime and performance.
Performance SLA is one of the Feature used in HLM. Performance SLAs are essential for evaluating the health of WAN member interface links in SD-WAN setups. They operate by either dispatching probing signals to a server via each link or analysing session data captured by firewall policies. The assessment of link quality is based on key metrics such as latency, jitter, and packet loss. If a link fails all health checks, it is temporarily removed from the SD-WAN link load balancing group, and traffic is redirected through other functional links. Once the link meets the SLA criteria again, the routes are reestablished. This mechanism ensures that traffic is not sent through a faulty link, thus preventing data loss.
A health check is determined by a probe mode, protocol, and server, which together define the resource being evaluated and the evaluation method. Each health check needs to be tailored specifically to the resource it monitors, ensuring that the probe mode, protocol, and server align with the particular service. For instance, a health check for a VoIP service will differ significantly from one designed for a database replication service, reflecting the unique requirements and performance metrics of each service.
Probe mode
The probe mode can be set to active, passive, or prefer passive.
- In active mode, the FortiGate sends a packet of the type specified by the protocol setting towards the defined server. This allows you to evaluate the path to the destination server using the protocol that matches the service provided by the server.
- In passive mode, session information captured by firewall policies is used to determine latency, jitter, and packet loss. This has the added benefit of not generating additional traffic, and does not require the performance SLA to define a specific server for measurement.
- Prefer passive mode is a combination of active and passive modes. Health is measured using traffic when there is traffic, and using probes when there is no traffic. A protocol and server must be configured.
Protocol
Health checks support a variety of protocols and protocol specific options. The most used protocols (ping, HTTP, and DNS) can be configured in the GUI when creating a new performance SLA on the Network > SD-WAN > Performance SLAs page. The following protocols and options can be configured in the CLI using the set protocol <option> parameter:
| Protocol | Description |
|---|---|
| ping | Use PING to test the link with the server. |
| tcp-echo | Use TCP echo to test the link with the server. |
| udp-echo | Use UDP echo to test the link with the server. |
| http | Use HTTP-GET to test the link with the server. |
| https | Use HTTP-GET to test the link with the server. |
| twamp | Use TWAMP to test the link with the server. |
| dns |
Use DNS query to test the link with the server. The FortiGate sends a DNS query for an A Record and the response matches the expected IP address. |
| tcp-connect |
Use a full TCP connection to test the link with the server. The method to measure the quality of the TCP connection can be:
|
| ftp |
Use FTP to test the link with the server. The FTP mode can be:
|
Setting Up Health Link Monitor via GUI
- Navigate to SD-WAN Performance SLAs:
- Go to Network > SD-WAN.
- Select the Performance SLAs tab.
- Click Create New.
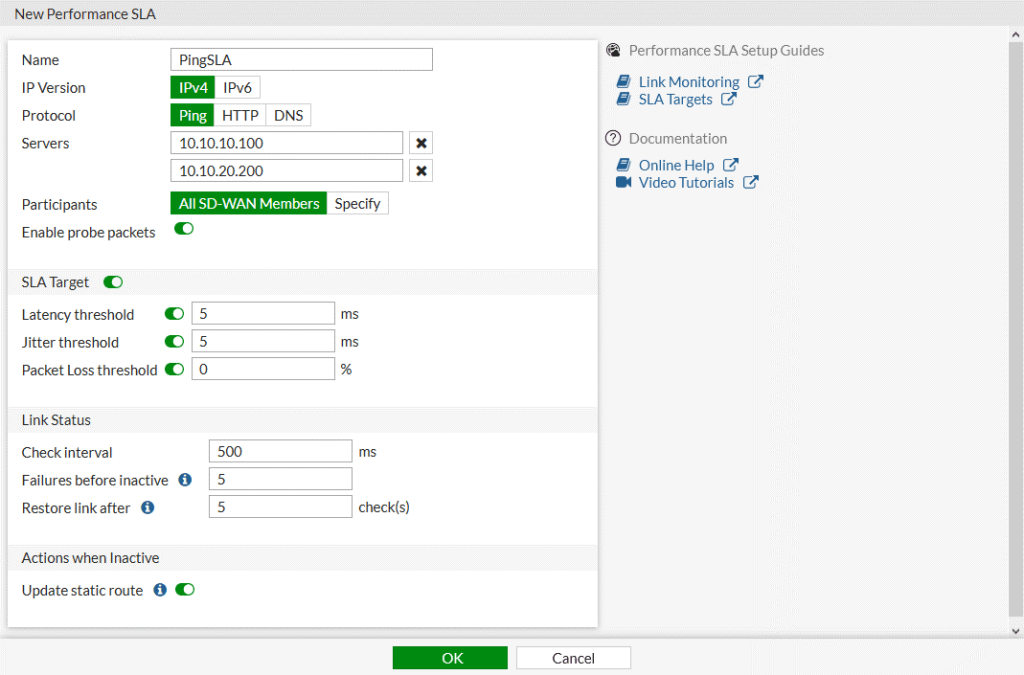
- Set SLA Name:
- Enter a Name for the SLA.
- Configure IP Version (if enabled in Feature Visibility):
- Set the IP Version. Note: IPv6 does not support all protocols.
- Set the Probe Mode:
- Active: Send probes to determine link quality.
- Passive: Use traffic to determine link quality. Enable passive health checks in policies to allow measurement.
- Prefer Passive: Operates like passive mode, but sends probes when there is no traffic.
- Choose the Protocol for Status Checks:
- Options: Ping, HTTP, or DNS.
- Set the Server:
- Enter the IP addresses of up to two servers reachable by all SD-WAN members in the performance SLA.
- If using the DNS protocol, set the DNS Server to either match the system DNS or specify primary and secondary DNS servers.
- Select Participants:
- Choose All SD-WAN Members or select Specify to choose specific members. It can be a WAN Link, VPN Links depending on the requirements.
- Enable Probe Packets:
- Toggle to enable or disable sending probe packets.
- Configure SLA Target:
- Optional for SD-WAN rules using Manual or Best Quality strategies.
- Required for SD-WAN rules using Lowest Cost (SLA) or Maximum Bandwidth (SLA) strategies.
- When SLA Target is Enabled:
- Latency threshold: Calculated based on the last 30 probes (default = 5ms).
- Jitter threshold: Calculated based on the last 30 probes (default = 5ms).
- Packet Loss threshold: Calculated based on the last 100 probes (default = 0%).
- Configure Link Status:
- Check interval: Interval for FortiGate interface checks, in milliseconds (500 – 3,600,000, default = 500).
- Failures before inactive: Number of failed checks before marking the interface as inactive (1 – 3,600, default = 5). Prevents flapping.
- Restore link after: Number of successful checks before marking the interface as active (1 – 3,600, default = 5). Prevents flapping.
- Actions When Inactive:
- Enable Update static route to disable static routes for inactive interfaces and restore routes when interfaces recover.
- Click OK
Configuring Health Link Monitor via CLI
If you prefer using the command-line interface for configuration, FortiGate provides equally powerful options.
To configure a link health monitor in the CLI:
config system sdwan
    config health-check
        edit "PingSLA"
            set addr-mode {ipv4 | ipv6}
            set server <server1_IP_address> <server2_IP_address>
            set detect-mode {active | passive | prefer-passive}
            set protocol {ping | tcp-echo | udp-echo | http | https| twamp | dns | tcp-connect | ftp}
            set ha-priority <integer>
            set probe-timeout <integer>
            set probe-count <integer>
            set probe-packets {enable | disable}
            set interval <integer>
            set failtime <integer>
            set recoverytime <integer>
            set diffservcode <binary>
            set update-static-route {enable | disable}
            set update-cascade-interface {enable | disable}
            set sla-fail-log-period <integer>
            set sla-pass-log-period <integer>
            set threshold-warning-packetloss <integer>
            set threshold-alert-packetloss <integer>
            set threshold-warning-latency <integer>
            set threshold-alert-latency <integer>
            set threshold-warning-jitter <integer>
            set threshold-alert-jitter <integer>
            set vrf <integer>
            set source <ip address>
            set members <member_number> ... <member_number>
            config sla
                edit 1
                    set link-cost-factor {latency jitter packet-loss}
                    set latency-threshold <integer>
                    set jitter-threshold <integer>
                    set packetloss-threshold <integer>
                next
            end
        next
    end
end
Proactive Network Monitoring with Linkeye.io
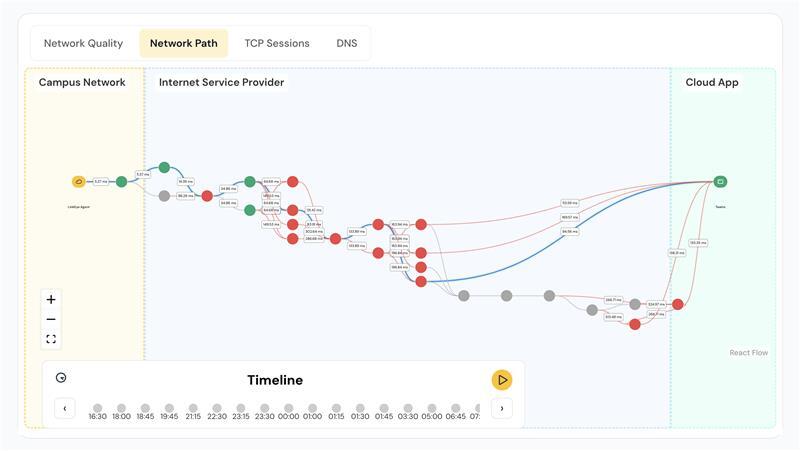
LinkEye continuously monitors all WAN circuits using internal and external probes. When a WAN circuit fails, the AI engine initiates a series of troubleshooting procedures via SSH/API calls to the FortiGate device. If the AI identifies the ISP as the root cause of the failure, a ticket can be automatically logged with the ISP.
In addition to monitoring WAN circuits, the LinkEye agent at each facility oversees business-critical applications by synthesizing application traffic to the application IP/URLs. It provides link performance data that can impact application performance. The agent mimics user interactions with the applications and alerts if there are any anomalies due to link availability or performance issues.
Conclusion
FortiGate’s Health Link Monitor and Linkeye.io Integration features are:
- Manage and monitor all WAN circuits globally.
- Pro-active SD-WAN auto-troubleshooting with AI.
- Deep insights into ISP service SLA violations.
- Application experience monitoring.
- Unparalleled security protection provided by the Fortinet Security Fabric.
To book a free demo click this link https://linkeye.ai/