What do a misconfigured DNS record, a congested SD-WAN link, and an expired SSL certificate all have in common? They show up in user complaints, but rarely in dashboards that focus only on latency or packet loss.
Many digital experience monitoring platforms today emphasize edge telemetry: page load times, synthetic script runs, session reply. These are useful, but without tying session symptoms to network-state or backend issues, they amount to surface-level diagnostics: visually rich, but functionally shallow.
In modern SaaS-heavy, hybrid, global enterprises, real users often face disruptions that reflect orchestration or infrastructure failures, not frontend glitches. That’s why closing the critical gap between symptoms and causality is all the more important.
Symptoms without Solutions: The UX Black Box
Real incidents often surface in surprising ways:
- A branch’s SSO logins fail because an MPLS-to-Internet failover triggered a DNS server timeout.
- A sudden spike in jitter derails a VoIP call mid-transaction.
- An SD‑WAN policy update silently routes traffic over congested peering links.
- A SaaS login fails due to an expired SSL certificate, creating backend API delays.
These are symptoms of infrastructure misalignment, not application bugs.
When NetOps, DevOps, and Helpdesk each look at the same session complaint through their siloed lenses, multiple root-cause hypotheses emerge and resolution gets delayed. Meanwhile, the user’s digital health i.e. their ability to work, transact, or serve customers, is the real stake on the line, which is why true User Experience Monitoring must correlate across layers to combat this fragmentation. That is also why it’s still rare, even though the need has never been clearer.
The Observability-Driven UX Stack
A network-aware observability platform stitches together four telemetry layers:
- Edge telemetry: Real User Monitoring (RUM) + synthetic probes simulate and reflect real session behaviours.
- Network performance data: DNS resolution times, jitter variance, SD-WAN path changes, failover logs, and internet routing anomalies.
- Session context: SSL certificate validity, DNS resolution behaviour, and trace route performance across possible and current paths.
- Trace and log correlation: Linking session failures to backend latency, DNS response issues, and path congestion.
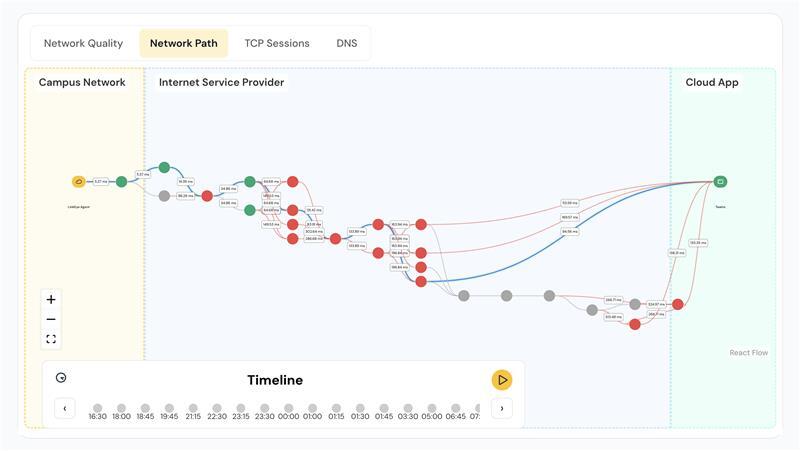
When stitched correctly, an engineer can trace:
“User login initiated → DNS query delayed 800 ms → SD‑WAN reroute → congested carrier latency → backend API timeout.” This provides clear context for a true understanding of why the user experienced disruption.
But building full-stack, correlated observability faces three barriers:
- Siloed tools and teams: network, applications, endpoints often operate in isolation.
- High telemetry overhead: ingesting and storing correlated user flows is resource-intensive.
- Lack of a semantic session model: no common handshake between “user click” events and “network logs.”
Still, adoption is accelerating. According to Gartner’s 2024 Magic Quadrant for DEM, around 60% of digital initiatives now rely on digital experience monitoring, up from just 15% a few years ago.
And the urgency is very real. A 2025 report by Conviva found that 91% of users experienced frustrating digital service issues in the past year. More than half abandoned purchases, and nearly 40% cancelled subscriptions due to poor digital experiences. These are often rooted in network-level degradation. And if monitoring doesn’t reflect that, businesses risk missing the real source of user churn.
Incident Response: The Core of User Experience Monitoring
User Experience Monitoring shows its value in active workflows. Consider a session where a user reports failed login. The application dashboard logs an API failure around the 6-second mark. At the same time, DNS resolution delays are recorded. A trace route reveals traffic was rerouted over a secondary path due to a recent SD-WAN policy change, and the rerouted link shows signs of congestion. An expired SSL certificate is also detected during the session trace.
With these telemetry layers correlated, the root cause becomes clear without escalation loops or guesswork. MTTR drops, resolution confidence increases, and teams align on shared data instead of assumptions.
This kind of response is possible only with the right telemetry and metrics. Traditional metrics like average latency or uptime percentages don’t reflect actual user experience. Modern UEM monitoring focuses instead on indicators that reflect how infrastructure impacts real sessions.
- Session-Failure Correlation Rate: What percentage of failed sessions are traceable to an infrastructure or path-layer issue?
- Time-to-Root-Cause: How long does it take to move from symptom detection to identifying root cause?
- Infrastructure Variability Metrics: Includes metrics that explain performance instability such as jitter fluctuation, DNS lookup variance, SD-WAN failover frequency
- Journey Deviation Detection: Tracks unexpected changes in routing, CDN behavior, or trace anomalies that deviate from historical baseline.
Connecting Experience to Root Cause
If you can’t link a user complaint to an infrastructure event, you’re logging symptoms in high resolution, but you’re not interpreting pain. And UEM is a lens to interpret infrastructure, networking, and application data through the lived experience of the user.
Industry analyses on digital experience monitoring trends, including those from players like ThousandEyes, highlight Experience Level Objectives (XLOs) as a more meaningful way to capture service quality by measuring how users actually experience performance, rather than whether individual components appear “up”.
Tools like LinkEye operationalize this principle through an AI-driven correlation engine that ingests edge telemetry, network performance metrics, session context, and trace/log data in real time. RCA (Root Cause Analysis) agents apply multi-layer data correlation to pinpoint the most probable origin on an issue, whether in the network, application stack, or delivery path, and recommends targeted remediation steps. By automating what once required hours of manual investigation across traditionally siloed teams, we eliminate conflicting diagnoses, accelerate resolution, and protect the user’s ability to work, transact, and serve customers without disruption.
As enterprise environments become more distributed and hybrid, the ability to connect user experience with infrastructure is increasingly becoming a baseline requirement for reliability, trust, and uptime. And for organizations serious about performance, it’s how competitive advantage will be won.